 After a prolonged obsession with the optimization of automated collection processes, Quantrax, in 2005, set out to develop and evaluate its own scoring technology. Since RMEx is probably the finest workflow engine for account management, a reliable score would greatly enhance a company’s ability to optimally manage its resources and its bottom line. New scoring systems announced by the major credit reporting agencies Equifax, Experian and Trans Union are likely to face challenges in the way that those scores are interpreted. How these scores affect collection accounts and later-stage collections will also be interesting and may take time to be understood. For the collection industry, we believe that the timing is perfect for new analytical tools that do not rely on traditional FICO-type scores.
I-Score is a product that has reinvented the rules of scoring for collection accounts. The compelling design does not utilize a credit score. Visionary thinking has created an entirely new concept and results that do not seem possible without access to a debtor’s credit history.
The following were considered as Quantrax evaluated this project as a technical challenge and a potential business opportunity.
- We wanted to find a solution that was better and could be priced competitively when evaluated against other solutions.
- For Quantrax to build a better solution, they would need a better approach. We felt that our knowledge of the debt collection industry was superior to that of other companies. Since we were solving a collection problem, this could be a great advantage for Quantrax.
- Traditional approaches rely on credit history and information from external databases. We were not aware of many companies using the collection history that was already available within your company. We believed that your data was a critical part of any model for scoring collection accounts.
- Rather than building models based on specific factors that we know affect the collectability of an account (e.g. age at placement or balance), we believed that we would obtain better results by making no assumptions. We decided to start with all of the data that we knew could affect collectability. We would then let our model
 figure out exactly what circumstances could make an account more collectable. (E.g. Debtors between the ages of 35 and 40 in a specific area were more likely to pay a credit card bill than a medical bill, but the results would be different for similar debtors and accounts in a different area!)
 - One of the most powerful technologies that are able to analyze and determine these complex relationships between many variables is “neural network” technology (neural networks are based on the parallel architecture of animal brains). Quantrax’s models were totally neural network-based and used the finest mathematical modeling software that is available today.
- Quantrax’s approach combines the advantages of data mining and neural network technologies.
- The key to developing successful neural networks is the selection and quality of the information that is used to train the network. One of the keys to Quantrax’s success is the selection and manipulation of the data entities, as well as the application of neuro-fuzzy techniques to the learning processes.
In the summer of 2005, Quantrax designed a model based on the above. From different clients, we downloaded 150,000 to 300,000 older accounts and used about half those accounts to build a model. Within these accounts there were paying accounts, accounts from different areas, accounts that had linked to other accounts, profitable clients and clients with low recovery rates. After we built the model, we looked at the rest of the accounts, “hiding” any payment information from the process. We then used our model to try to predict which of the new accounts would have paid.
Here is an example of a test we ran against RMEx data. We looked at about 84,000 accounts and sorted them by what we predicted as most collectable down to the least collectable. The data is analyzed and presented in 20 groups. The scores for each group were lower, as you went down the list of categories. As you will see, the majority of the paying accounts (any money received) were in the higher groups. 85% of the paying accounts were in the top 50%. If you had only worked 60% of your accounts, you would have collected from 91% of the accounts that would have paid! With regard to dollars collected, 92% of the money collected was in the top 60%. Remember that these accounts were all worked without paying attention to the scores. In a production environment, more effort would be put into the higher scores, resulting in even more being collected within those categories.
|
Category
|
Group
Size |
Paying Accounts
|
A(%)
|
B(%)
|
Net
Placement ($) |
Current
Balance ($) |
Total
Payments ($) |
Fraction
Paid |
C(%)
|
Cum%
Paid |
|
1
|
4,196
|
3,154
|
75.17
|
20.24
|
1,021,672.78
|
639,617.17
|
382,055.61
|
37
|
13.66
|
13.7
|
|
2
|
4,196
|
2,229
|
53.12
|
34.55
|
2,033,843.12
|
1,597,070.94
|
436,772.18
|
21
|
15.62
|
29.3
|
|
3
|
4,196
|
1,676
|
39.94
|
45.31
|
1,661,814.07
|
1,339,274.23
|
322,539.84
|
19
|
11.54
|
40.8
|
|
4
|
4,196
|
1,331
|
31.72
|
53.85
|
1,683,873.72
|
1,289,182.13
|
394,691.59
|
23
|
14.12
|
54.9
|
|
5
|
4,196
|
1,133
|
27.00
|
61.12
|
1,290,179.24
|
1,116,879.08
|
173,300.16
|
13
|
6.20
|
61.1
|
|
6
|
4,196
|
973
|
23.19
|
67.36
|
1,358,490.46
|
1,222,712.98
|
135,777.48
|
10
|
4.86
|
66.0
|
|
7
|
4,196
|
892
|
21.26
|
73.09
|
1,608,806.53
|
1,440,347.54
|
168,458.99
|
10
|
6.02
|
72.0
|
|
8
|
4,196
|
748
|
17.83
|
77.89
|
1,647,421.57
|
1,491,165.48
|
156,256.09
|
9
|
5.59
|
77.6
|
|
9
|
4,196
|
637
|
15.18
|
81.98
|
1,536,401.11
|
1,414,015.35
|
122,385.76
|
8
|
4.38
|
82.0
|
|
10
|
4,196
|
528
|
12.58
|
85.37
|
1,684,516.51
|
1,581,591.76
|
102,924.75
|
6
|
3.68
|
85.7
|
|
11
|
4,196
|
480
|
11.44
|
88.45
|
1,473,890.70
|
1,363,807.77
|
110,082.93
|
7
|
3.94
|
89.6
|
|
12
|
4,196
|
391
|
9.32
|
90.96
|
1,456,767.25
|
1,389,289.45
|
67,477.80
|
5
|
2.41
|
92.0
|
|
13
|
4,196
|
295
|
7.03
|
92.85
|
1,577,515.07
|
1,538,012.40
|
39,502.67
|
3
|
1.41
|
93.4
|
|
14
|
4,196
|
248
|
5.91
|
94.44
|
1,748,119.16
|
1,710,461.58
|
37,657.58
|
2
|
1.35
|
94.8
|
|
15
|
4,196
|
236
|
5.62
|
95.96
|
1,648,348.50
|
1,623,110.28
|
25,238.22
|
2
|
0.90
|
95.7
|
|
16
|
4,196
|
214
|
5.10
|
97.33
|
2,134,065.01
|
2,091,798.28
|
42,266.73
|
2
|
1.51
|
97.2
|
|
17
|
4,196
|
140
|
3.34
|
98.23
|
2,582,533.86
|
2,560,791.31
|
21,742.55
|
1
|
0.78
|
98.0
|
|
18
|
4,196
|
126
|
3.00
|
99.04
|
2,027,115.68
|
2,008,138.60
|
18,977.08
|
1
|
0.68
|
98.6
|
|
19
|
4,196
|
86
|
2.05
|
99.59
|
2,300,094.26
|
2,286,959.14
|
13,135.12
|
1
|
0.47
|
99.1
|
|
20
|
4,182
|
64
|
1.53
|
100.00
|
3,545,868.02
|
3,521,019.95
|
24,848.07
|
1
|
0.89
|
100.0
|
|
83,906
|
15,581
|
18.57
|
36,021,336.62
|
33,225,245.42
|
2,796,091.20
|
8
|
||||
Net placement = Total Placements – Total adjustments (for the category)
A =Number of paid accounts / Total number of paid accounts (for the category)
B = Number of paying accounts within the above category / Total paying accounts (for all categories up to and including that category)
Fraction paid = Total payments for category / Net placements (for the category)
C = Total payments within the category / Total payment amount (for all categories)
Cum% paid (Cumulative % paid) = Percentage (dollars) paid as a total of all payments, for all categories up to and including that category.
“Paying accounts” refers to accounts where some money was collected, not necessarily a payment in full. Our reasoning was that if you were able to collect anything from a debtor, the ability to receive payment in-full is often based on the collector’s skills. Identifying the accounts that could generate any size of payment was the key to the classification of accounts.
|
The scores are based on “absolute” and not “relative” values. This means that the accounts placed at the top of the list are not automatically assigned high values. If most of the accounts in a given batch are not considered collectable, then there will be only be a few accounts with higher scores.
|
It is important to note the following.
- The results were obtained with only a company’s own data. No credit data was used.
- The first 10 groups had 50% of 83,906 accounts that were analyzed.
- The first 10 groups (the top 50%) contained over 85% of the accounts that received a payment.
- That top 50% also had 85% of the dollars collected.
- 92% of the dollars collected were within the first 12 groups, which represents 60% of the accounts analyzed .
In the above example, you could have collected 92% of accounts paid on, by working only 60% of the accounts placed! That knowledge could translate to faster recoveries at significantly lower operating costs. Remember that the results are based on real accounts and are not numbers made up by Quantrax. Most experts would agree that these are excellent results considering the fact that no credit scores were used. In our research, we did compare our scores with some of the “collection scores” supplied by credit reporting agencies and other scoring companies. Interestingly, we found that our product (without using a credit score) was able to identify most of the accounts that received higher scores based on having a better credit history. Note that the similar results to those described above were obtained from different Quantrax clients, in a range of geograrphical areas and for accounts ranging from fairly recent debt
How does Quantrax explain their outstanding results?
We believe that the following explains some of Quantrax’s early success in the area of scoring.
- Scoring companies do not understand collection data elements and collection processes as well as Quantrax.

- Quantrax’s approach used the best combination of engineering, mathematics and collection industry knowledge. The research and development teams were made up of some uniquely talented individuals from the US and Europe, including the universities of Oxford and London.
- The Quantrax model utilizes several data elements that have never been considered by the other scoring companies. We believe that the inputs are analyzed uniquely and that this contributes significantly to the results.
- Quantrax’s proprietary manipulation and use of demographic data play a critical role in the creation of the scoring models.
- Quantrax’s solution is entirely based on neural network technology. It is generally accepted that neural networks can not be effectively applied to random data or circumstances. As a result, Quantrax’s initial efforts were to understand if “paying accounts” were a random occurrence or something that could be predicted because they fell into what is described in statistics as a “normal distribution”. The logical conclusion is that if all accounts were worked the same way, some and only some of them would pay. That leads us to believe that payment patterns and results obtained are not random. Quantrax was able to prove this, since its predictions closely matched the actual results obtained. Quantrax’s single-minded focus on neural network technology was more than justified under the circumstances.
- The product was developed using the most advanced technology that is available to solve complex problems that require advanced mathematical modeling tools. For example, Quantrax’s scoring models use the same software environment that is used by every major aerospace and defense organization in the world to develop air, naval, land and space systems.
And how would you utilize these scores? With RMEx, we provide an interface that allows you to apply Smart Codes based on the ranges of scores returned. With our knowledge-based system, you can automatically change workflows, collectors, letter strategies or work plans based on the levels of decision-making within the system. Analyzing collection results based on the scores is also easy. We provide reports that show paying accounts based on the range of scores, as in the following example.
As you look at the screens and begin to think about how you could incorporate scoring into your business model, you should consider the following.
- No scoring model can claim to accurately tell you who will and will not pay.
- There will always be collectable accounts that will be scored low. Similarly, you will not collect from many high-scoring accounts.
- Scores are an indicator and you are always responsible for evaluating the reliability of any scoring system.
- Our goal is to provide reliable results for a very large percentage of the accounts scored.
- Giving a lower score to some collectable accounts is not damaging if those accounts get collected quickly or with a little effort compared to the success with other low-scoring accounts. You could consider using an additional credit score on some of the lower-scoring high balances, to find out if they may qualify to be considered more collectable.
- Assigning higher scores to accounts that can not be collected will not be costly if the number of accounts is small. You will have fewer high scoring accounts and you will not be using a large percentage of your resources on these accounts.
- Numbers can also be deceptive. A single large payment can skew the analysis and this must be considered carefully. In general if a collectable account was placed in a low-scoring group, there is a good chance that the account would be recovered with minimal effort. While it is our recommendation that additional resources and time be allocated for higher-scoring accounts, we do not suggest that you put no effort on the lower-scoring accounts! These accounts must also be worked, but worked economically. Let us now consider some results after accounts have been worked based on the scores. In the following, Prof.Index is a profitability index. It looks at the amount paid for each group, compared to the number of accounts in the group. Assuming you put the same resources into all of the accounts in the group, this index is an indication of the amount collected per debtor, for accounts within the group. The larger the number, the more profitable those accounts are likely to be.
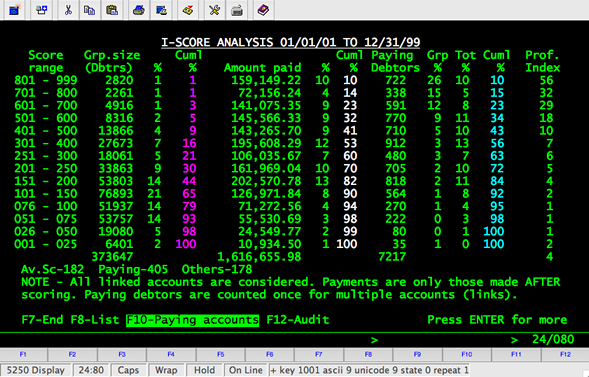
In the above analysis, we have looked at a large group of accounts, only considering the payments received after the accounts were scored. Note the increase in the percentages of amounts paid and paying debtors as the scores increase.
- Grp% is the percentage of paying debtors calculated against the group size.
- Tot% is the percentage of paying debtors calculated against the total number of paying debtors for all groups.
- Cuml. % shows percentages for all the groups up to and including the group referred to on that row.
Many of you who utilize scoring, can not effectively analyze the results and benefits. We have invested in features that will allow you to review the scored accounts in great depth, helping you to understand why a scored account may or may not have generated a payment.
Additional information can also be found within a white paper on Quantrax’s scoring systems.